The goal of the study was to evaluate video performance for three weeks, paying particular attention to engagement indices and the number of viewers. The ambition was to uncover patterns that could benefit future content strategy by examining daily posts. Understanding how engagement metrics relate to viewership is important for discovering the content that connects with the audience.
To measure the engagement rate based on interactions, data was collected by posting two videos each day at varying times and then aggregating total views. To visually represent the performance, each video was color-coded: red indicates videos that didn’t hit 500 views, while green marks those that did or surpassed it. This strategy made it more simple to distinguish the most prosperous days and videos.
Before We Get Into It:
Sundays are not ideal for posting anything, and we cover the specific niche where this applies in our paid course, using "Tiny Twitter Niche" as a placeholder. Our goal is to reach 500 views per account with just 100 followers, measured over one week from the posting date.
If you're wondering what the "Tiny Twitter Niche" is, that information is reserved for our premium users. This post gives a broad overview of the research and strategies that contributed to my growth. However, if you're serious about learning the exact niche I’m working in, head over to my Whop shop's Growth Insider role, where I share all the full, exclusive insights, including how I found this niche.
The Growth Insider role isn’t about offering vague tips—it provides a detailed, step-by-step guide on how I achieved success. Inside the premium resources channel, I reveal the exact niche I’m targeting, why it works, and how you can use these strategies for your growth. It’s clear, actionable, and designed to deliver real results.
Get Here: EvolvedLotus Store
Week 1

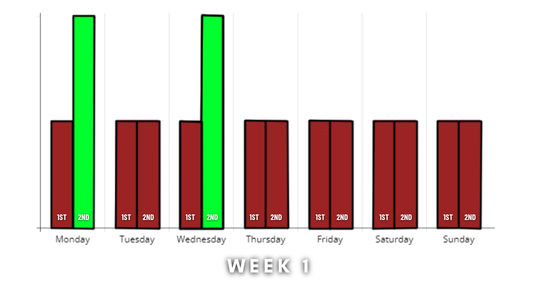
Our key emphasis in Week 1 was on the collection of data to analyze engagement and viewership. To learn why specific videos drew attention and which ones did, we posted two videos each day, from Monday through Sunday. The goal was to evaluate how effectively the videos performed in terms of views and engagement, particularly when looking at engagement percentages compared to the 500-view mark (green) or just falling short of that (red).
Monday saw issues for the first video; engagement was just 1.4%, and it didn’t hit 500 views. In any case, the second video tracked a success that surpassed 500 views and achieved a good 5.4% engagement rate. Tuesday turned out to be a brutal day for both videos since neither had exceeded 500 views. The initial video yielded an engagement rate of 0.69%, while the second one showed a slight upgrade to 2.7%, but didn’t measure up.
Wednesday had mixed results. Only 3.3% of users engaged with the video, so it fell short of the 500-view requirement. In any case, the second video still went over the green zone, registering a 1.3% engagement rate that signals a limited link between high views and high engagement. Thursday through Saturday has seen regular underperformance in content. In that period, though engagement levels differed, all the videos failed to reach the green category. The first video on Wednesday got 3.6%. While engagement rates improved, none of the videos from
Friday & Saturday managed to hit more than 500 views. Sunday turned out to be fascinating. The first video's engagement rate was an unusual 13%, becoming the highest engagement rate for the whole week. Centered around this form of audience interaction, it still did not reach the 500-view benchmark, leading to questions about how engagement correlates with viewership. The 1.3% engagement recorded for the video that day situated it indisputably in the red zone.
Upon considering Week 1, there is a small group of key observations. More engagement doesn’t necessarily equate to more views, as videos with less engagement can often outperform others in viewership. The achievement of Monday’s second video and Wednesday’s second video implies that various times of the day or categories of content may click better with the audience. Engagement spiked on Sundays without the corresponding views, suggesting that viewer behavior could be driven by more than simply the content. Future weeks will require more stable testing to figure out if there is a connection between specific days or posting times and enhanced performance.
Week 2

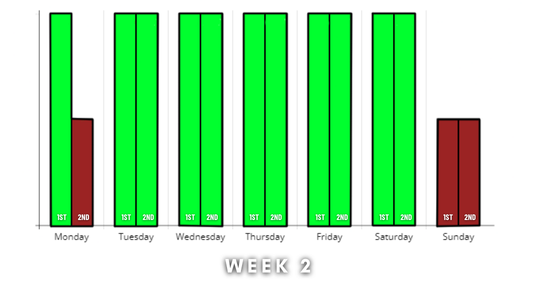
In Week 2, our principal goal was to follow the engagement and viewership of two daily videos, from Monday through Sunday. We looked into every video's performance, concentrating on the engagement percentage and whether it hit the 500-view mark. Our system shows a video as green when it has surpassed 500 views and red if it didn't. One must point out that the engagement percentage is not always proportional to the amount of views. Here’s a summary of the week’s data:
The first video on Monday succeeded in reaching an engagement rate of 3.7% and exceeding 500 views, turning green. From a unique perspective, the second video garnered only 1.2% engagement, finally resulting in a poor engagement metric that showed engagement alone is not the only factor for view count. On Tuesday as a whole, it was an improved day; both videos made it into the green zone. The engagement rate for the first video was 6.3%, but the second video outperformed that at 6.9%. This indicates that Tuesday's material connected with the audience better, thereby driving up engagement and viewers.
Wednesday continued the trend, with both videos showcasing strong engagement rates: the beginning video recorded a completion rate of 7.4% and the final video reached 4.6%. Each surpassed 500 views and remained in the green. The first video maintained its performance on Thursday with 5.6% engagement, in contrast, the second video lagged, only amassing 1.9% engagement and failing to reach 500 views, which put it in the minus column.
Engagement for both videos dropped slightly on Friday, although they remained in the green zone. On Saturday, the engagement rates for both videos were outstanding after they surpassed the 500-view mark. The impressive engagement rate for the second video was 11.5%. Ultimately, on Sunday, both videos kept their spots in the green zone, reporting engagement rates of 2.3% and 2.1% for the first and second videos, respectively.
It is obvious from Week 2 that posting videos on Tuesday and Wednesday led to increased engagement rates and viewership. In opposition, Thursday's performance dropped slightly. The second video particularly stood out on Saturday as the best performing, with both videos doing remarkably well. This information reflects that certain videos can do better even when engagement is not high. In addition, the sustained strength of performances on selected days implies that these could be the best times to post.
Week 3

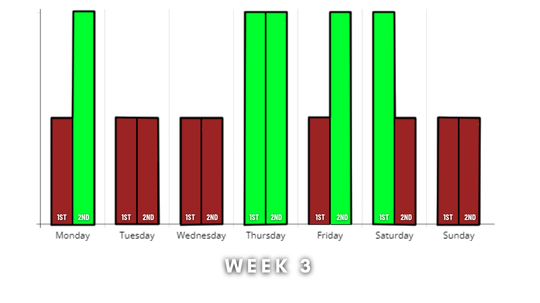
In Week 3, our close evaluation of two daily videos from Monday to Sunday focused on measures of engagement and viewership. The intention was to find trends in audience participation and to discover the optimal days for posting. Throughout the week, a combination of red and green results offered us insights into audience behavior. We should dissect the performance of each day.
The first video released on Monday achieved only a 1.3% engagement rate, failing to hit 500 views and turning red. The second video managed a slightly better result, obtaining a 2.3% engagement rate and getting over the view limit, in keeping with green. Although this constituted a good base, the results did not stand out.
The attendance on Tuesday didn't prove to be successful, because neither video hit 500 views. There was a 4.3% engagement rate for the first video, compared to the second which went down to 1.3%, both still appearing red. This indicated that superior engagement metrics may not reflect an increase in view counts.
The findings from Wednesday were incredibly impressive. A 20% engagement rate came from the first video, but it still didn’t achieve 500 views, keeping it under the red. 2.0% of engagement took place with the second video. This demonstrated the variance between engagement and viewer statistics. Thursday's show was more powerful. The first video recorded an engagement rate of 7.3%, blew past 500 views, and earned green, and soon the second video arrived with an engagement rate of 6.0% which also earned green. This made Thursday the most triumphant day of the whole week.
What they were still not clear came out on Friday evening. The first video, to reach a 6.8% engagement rate, did not get more than 500 views and was left red. Nonetheless, the second video, unexpectedly, turned green with an engagement rate of 2.2%. This proved that some content got more attention than others. Saturday followed the same pattern as Friday with the second video getting more than 500 views and achieving a 3.1% engagement level which turned green. For the first video, the engagement rate was only 2.3%, but it kept the red color; this shows that viewership can indeed shift significantly. As for Sunday’s videos, they again did not reach 500 views and are in the negative this week’s end. The first video secured an engagement rate of 5.2%, the second one got slightly higher with 5.6%. However, it led to even a higher level of engagement and that did not translate to a higher visibility level.
Considering the data for the week, I understood that the engagement percentages may be quite misleading, as it was on Wednesday. Thursday turned out to be the best day, though the posts made in the early weeks were not so effective. This suggests that time could be an important factor that affects viewership success. We will have to keep on monitoring the activity to see when the best time to post is, alongside giving the best content that will increase both the view rate and engagement rate in the future.
Conclusion
Over the three weeks, some trends were observed in posting time, level of engagement, and views. Content shared during the week in the middle of the week received higher engagement levels and higher views on average. We also noted that increased engagement did not always lead to more views, which was a common issue observed throughout. However, there was engagement in specific instances, for instance on Thursday and Saturday.
From these findings, it may be useful to alter the posting frequency and fine-tune the content in response to past successes. The current findings suggest that posting at busy hours and even testing the length of the posts may also enhance the interaction as well as the reach of the material. It can be seen that there is no universally applicable business model, and thus flexibility is paramount.
It is also important to know the outcome in the future as well as experiment with the strategies in the future. Incorporation of these findings in the content plan would mean that there could be higher engagement and therefore increased viewership in the future. It was beneficial to experiment with various strategies, as there is a great deal to be gained from such testing.


Join the Conversation
Share your thoughts, questions, or experiences related to this article.
Comments are moderated and will appear after approval.